The Government has introduced legislation to Parliament to establish the new Ministry for Cities, Environment, Regions and Transport (MCERT), a key step in delivering its ambitious reform agenda across housing, transport, urban development and the environment.
The Environment (Disestablishment of the Ministry for the Environment) Amendment Bill paves the way for the Ministry for the Environment to integrate into MCERT alongside the Ministry of Housing and Urban Development, the Ministry of Transport, and the local government functions of the Department of Internal Affairs.
“The new agency will be at the heart of tackling some of New Zealand’s greatest economic and environmental challenges, from housing affordability and our infrastructure deficit to climate adaptation,” RMA Reform Minister Chris Bishop says.
“The Ministry for the Environment is the only agency forming MCERT that was established by statute. That means it is the only Ministry that requires legislative change to enable the new department to be created, and we are moving swiftly to make that happen.”
Environment Minister Penny Simmonds says the amendment to the Environment Act will formally disestablish the Ministry for the Environment and transfer its statutory responsibilities to the Secretary for the Environment.
“MCERT will administer the Environment Act, with its chief executive fulfilling the role of Secretary for the Environment, ensuring a seamless transition and continuity of environmental oversight.
“Environmental functions remain a core part of the new Ministry’s work. Bringing related portfolios together in one department will provide integrated, practical advice that both protects our environment and lifts prosperity for communities across New Zealand.”
MCERT is set to be established from 1 April 2026 and become operational from 1 July 2026. A chief executive for the new agency will be appointed in the coming months.
19 February 2026 – The Reserve Bank of New Zealand will increase the number of scheduled monetary policy decisions from 7 to 8 per year, starting in 2027.
The Monetary Policy Committee has discussed the upcoming increase in the frequency of Consumers Price Index (CPI) data releases. From next year, CPI data is set to be published on a monthly basis, rather than quarterly. Due to this, the Committee believes it is appropriate to move to 8 scheduled decisions.
To accommodate an 8 decision schedule, the previously announced February 2027 decision date has been moved a week earlier.
While we have set dates out to February 2028, the Monetary Policy Committee can make unscheduled decisions at any time, should financial or economic conditions warrant it, and have done so in the past.
Our Financial Stability Reports will continue to be released twice a year, in May and November.
Monetary policy and OCR dates
DateAnnouncement 2026 8 April Monetary Policy Review and OCR 27 May Monetary Policy Statement and OCR 8 July Monetary Policy Review and OCR 2 September Monetary Policy Statement and OCR 28 October Monetary Policy Review and OCR 9 December Monetary Policy Statement and OCR 2027 10 FebruaryMonetary Policy Review and OCR 17 MarchMonetary Policy Statement and OCR 5 May Monetary Policy Review and OCR 16 JuneMonetary Policy Statement and OCR 4 AugustMonetary Policy Review and OCR 15 SeptemberMonetary Policy Statement and OCR 27 October Monetary Policy Review and OCR 8 DecemberMonetary Policy Statement and OCR 2028 9 FebruaryMonetary Policy Review and OCR
Source: The Conversation (Au and NZ) – By Maria O’Sullivan, Associate Professor of Law, Member of Deakin Cyber and the Centre for Law as Protection, Deakin University, Deakin University
In the wake of the Bondi terror attack, multiple state governments have passed laws to restrict mass protests. Most notably, the New South Wales government introduced controversial legislation giving police the power to restrict public protests for up to 90 days after a terrorist incident.
This unprecedented restriction was tested when thousands took to the streets to protest against the visit of Israeli President Isaac Herzog.
The protest was followed by widespread allegations of police brutality. These are currently being investigated by the state’s police watchdog.
The organisers of the protest are also challenging the constitutional validity of the laws in the NSW Court of Appeal.
This latest round of law reform follows long-running concerns about whether the right to protest in Australia is under threat. Two years ago, the Human Rights Law Centre found “protest is in peril”. Little has changed since.
So, what do these state laws do, and how might they affect people’s democratic right to protest? How can lawmakers strike the right balance between human rights and the protection of public safety?
States tightening anti-protest laws
The right to protest has been restricted in many of Australia’s states and territories over recent years through increased fines and sentences for acts such as traffic obstruction.
These laws have been further tightened in the past year.
In NSW, the government passed legislation in December 2025 to allow the police to make a “Public Assembly Restriction Declaration”, following a terrorist attack.
As the name suggests, such a declaration means specific areas are restricted places for protest. If the police make this declaration, it grants them additional powers to:
move people on
close specific locations
search people inside a designated area
and issue orders to prevent disruption or risks to public safety.
A number of these declarations were made by NSW Police during the protests against Isaac Herzog’s visit.
The declarations have now lapsed, so they’re no longer in operation. However, the legislation allowing police to make them remains in force.
What about in other states?
In Queensland, draft legislation is currently before parliament. It will, among other things, allow the Queensland government to ban certain protest slogans.
If passed, it will be an offence to publicly use a prohibited expression in a way that “might reasonably be expected to cause a member of the public to feel menaced, harassed or offended”. This offence carries a maximum penalty of two years in prison.
Under this legislation, the government has announced they intend to ban two phrases: “from the river to the sea” and “globalise the intifada”.
[embedded content]
In Western Australia, the government has introduced a bill allowing police to refuse a protest permit if they believe the protest is likely to promote hate based on factors such as religion, race, disability, gender, sexuality or ethnicity.
While various protest restrictions have existed for some time, the recent use of police “declarations” is concerning. They may lead to disproportionate use of force or discriminatory policing practices.
Some of the new hate speech offences are also problematic as they exclusively restrict protest slogans used by some pro-Palestinian protesters. These laws can therefore be seen as targeting particular political causes.
Protesters pushing back
A number of challenges to government restrictions have been lodged with varying success in recent months.
In Victoria, protesters challenged a “designated area” declaration prior to the 2026 Invasion Day rallies. The Federal Court found in favour of the protesters, dismissing the declaration as unlawful.
The declaration gave police the power to search a person or vehicle without a warrant and to direct a person to leave the designated area if they refused to remove a face covering when requested to do so.
Invasion Day marches in Melbourne weren’t affected by police ‘stop and search’ powers after a successful court challenge by protesters.Jay Kogler/AAP
The court found the declaration unlawful for a number of reasons. First, the assistant police commissioner did not apply the correct legal criteria and did not satisfy key requirements under the relevant legislation. This meant there was a legal error in the way the decision was made.
Second, the assistant commissioner failed to give proper consideration to the right to privacy under the Victorian Charter of Human Rights.
In NSW, the Palestine Action Group recently tried to overturn a government declaration that Israeli President Herzog’s visit would qualify as a “major event” under the Major Events Act.
That declaration was significant because it granted police many of the additional powers outlined above.
That challenge, which had to be brought to court at short notice, did not succeed.
What can we do?
While governments in Australia are correct to address the perils of hate speech and consider public safety, there is a real concern that current legislation is weighted too heavily on the side of protest restriction.
One way lawmakers can strike a balance between the right to protest and other considerations is to adopt a human rights charter. This would include a formal process for considering the right to protest (and other rights).
Importantly, this should also enforce an obligation on police to consider the right to protest when making decisions (as occurs in Victoria under its state charter).
There have also been calls for a federal human rights act, as well as the introduction of human rights charters in states and territories that do not have one.
Combined, this would enshrine important legal recognition of our right to protest, which is fundamental to the functioning of a healthy Australian democracy.
You might have heard the common claim that electric cars aren’t really green – that their lithium-ion batteries rely on “blood” minerals such as cobalt, mined in terrible conditions.
The critique had some truth to it. But this claim is no longer accurate. Electric vehicle (EV) manufacturers have been shifting away from cobalt because it’s expensive, toxic and ethically fraught.
What’s replacing it? Cheaper lithium-ion battery chemistries based on lithium iron phosphate (LFP), which avoid cobalt entirely. If you remember high-school chemistry, you’ll remember batteries have an anode and a cathode. The anode is nearly always graphite. But the cathode can be made from many different minerals and compounds.
This means battery makers have a great deal of choice over which minerals to include. There’s huge innovation taking place in batteries, as the market grows and diversifies across vehicles and energy storage. Even cheaper chemistries are emerging based around salt (sodium-ion), while high-performance solid state batteries are coming close to reality.
For years, cobalt has been a mainstay in cathodes due to its useful properties, including how much energy it can help store.
When the first commercial lithium-ion batteries arrived in the 1990s, the chemistry relied on cobalt (lithium cobalt oxide). Over time, lithium nickel mangananese cobalt (NMC) oxide and lithium nickel cobalt aluminium (NCA) oxide came to dominate the market, as their high energy density made them ideally suited for portable electronics.
As demand for lithium-ion batteries accelerated, sourcing cobalt began to be a problem. Three quarters of mined cobalt comes from one country: the Democratic Republic of Congo (DRC), which has half the world’s reserves. Australia is second, with 20%.
Cobalt is toxic. In the DRC, many people risk their health in small mines under conditions often described as slave-like. Illegal and legal mines can do huge environmental damage.
This and other issues led researchers to begin working on reducing or cutting cobalt out altogether. This led to low-cobalt chemistries, in which most of the cobalt was swapped for nickel, manganese or aluminium. To date, it’s been difficult to remove cobalt entirely, given how much of a boost it gives to battery capacity and stability.
In parallel, US researchers found the mineral olivine – made of lithium, iron and phosphate (LFP) – was a good candidate for battery cathodes. This discovery gave rise to cobalt-free LFP batteries. LFP chemistry is cheap, non-toxic and safe, though slightly less energy-dense.
These batteries have had a meteoric rise. Last year, 50% of all EV batteries and more than 90% of stationary home and grid batteries used this chemistry.
Given world-leading battery makers now rely heavily on this chemistry, it’s likely LFP batteries will dominate the market for EV and stationary storage applications in the near term.
Many people work as creseurs – small scale miners – in the Democratic Republic of the Congo, risking their lives to extract cobalt, copper and gold.Fairphone, CC BY-NC-ND
Many next-generation batteries nearing the market are being developed for specific jobs – such as powering drones – or to outcompete current technology. Here are four new types to watch:
Sodium-ion: The world’s biggest battery maker, CATL, and other manufacturers are exploring an entirely different chemistry – sodium-ion – in a bid to eventually replace lithium-ion batteries as home or grid batteries. Sodium-ion batteries are typically heavier and less energy-dense than lithium-ion, so they wouldn’t work well in vehicles. But the chemistry has real promise for stationary energy storage.
Lithium-sulfur: These batteries rely on lithium and sulfur or sulfur-carbon composites. They can currently store four to five times more energy than traditional lithium-ion batteries, making them particularly useful for drones and other technologies where maximum power is needed. The challenge is giving them longevity, as the reactions in these batteries are harder to reverse. That means these batteries are harder to recharge many times at present. Several Australian companies are active in this space.
Solid state: Until now, lithium-ion batteries have relied on a liquid electrolyte as the medium for ions to shuttle between anode and cathode. Solid state batteries do away with the liquid, making them inherently safer. They could potentially lead to a drastic boost to energy storage. They’re not mainstream yet because it’s still tricky to get them to work at room temperature without using high pressure. If engineers figure this out, an EV using solid state batteries might travel 1,000km on a single charge.
Flow batteries: In the 1980s, Australian engineers at UNSW invented the vanadium redox flow battery. A cross between a conventional battery and a fuel cell, these typically larger batteries can feed power back to the grid for 12 hours or more, much longer than current lithium-ion battery systems.
These batteries are likely to be useful in renewable-heavy power grids. Lithium and sodium-ion batteries could provide shorter bursts of power to the grid, while flow batteries could kick in for longer periods.
So do we still need cobalt?
These developments are promising. But they don’t mean an end to cobalt entirely. Smaller amounts of cobalt will still be in the lithium-ion batteries in portable devices and EVs for the foreseeable future.
What we are likely to see is more recycled cobalt coming into the mix, as governments accelerate recycling of lithium-ion batteries and promote recycled minerals to be used in new batteries. Over time, the role of “blood cobalt” could disappear.
There is a growing number of “serious incidents” in Australian early childhood services, including day cares.
A serious incident is one that seriously compromises the health, safety or wellbeing of a child. There were 160 such incidents per 100 services in 2024–25. This is up from 148 and 139 in the previous two years.
These figures follow explosive revelations of safety issues and abuse in the sector.
In response, there are several new national child safety measures. These include banning personal phones in early childhood services, improving recruitment, and making sure parents can see a service’s compliance history.
Ratios are presented as a simple numerical safeguard to ensure enough qualified educators are present and working directly with children.
These can differ between states and territories, the type of service and the age of the children. However, for children aged under 24 months at daycare, there needs to be one educator for every four children. As children get older, the ratios change. For example, in New South Wales for children over 36 months, it is 1:10.
Tammy Williams’ recent PhD research interviewed 16 early childhood educators about their workplaces, which were a mix of for-profit services. Some were small, standalone services; others were part of large corporate chains.
They reported how ratios operate in practice can be very different from how they look on paper. This raises serious questions about how safe the system really is.
‘Under-the-roof’ ratios
The “under-the-roof” ratio is a common term in early learning services. Some services use this to calculate ratios based on the total number of children and educators across the building, rather than within each child’s regular room.
For example, an educator might have 12 children in their room instead of the regulated 1:10. But the room next door might have just eight, so on average, the ratio is met in theory. In the PhD study, one educator said:
There are times when you have two or three children over in your room, but they fit in another room, which I don’t understand. It puts so much more stress on the people in that room. I don’t even get why that is allowed.
Or educators might still be counted if they are having a break. This can be permitted in certain situations under some state regulations if the break is short and the educator is still in the same service as the children.
But media reports suggest this is overused by some services. Staff may also be counted when they are working in the office, or cleaning elsewhere in the service. Other staff, such as chefs and might also be included in the official count, even though this isn’t permitted.
As another educator noted:
Ratios, half the time, are not right […]
What are the rules?
Despite its widespread use, the term “under the roof” does not appear in the national laws or regulations. They clearly state staff counted in the ratios must be “working directly” with the children, and they must be “educators”.
So there is a mismatch between the law and how it is applied in practice. Regulators are increasing their inspections – including more unannounced visits. But regulators are also understaffed and services can go years between inspections. For planned inspections, services can “put on an act”, as one educator described.
‘There is a lot of stress’
When educators are stretched, this obviously limits their ability to provide safe, high quality education and care. In the PhD study, one educator also described how not having enough staff can lead to stress, which can flow on to the children.
I feel there is a lot of stress and […] they’re going to pick up on that and they’re going to feel it as well. I feel they miss out on things because there’s so much stuff that educators need to do.
If educators are too busy, it can also interfere with children’s relationships with educators and disrupt their daily routines and sense of security.
Despite Australia needing another 21,000 educators, educators constantly report wanting to leave, because of burnout and workplace conditions. As one interviewee explained:
The people who are passionate about being here are very, very passionate and they’re getting tired. They’re looking at moving into retail positions and cleaning positions.
What happens now?
Some flexibility when using ratios helps services adapt to unexpected day-to-day changes such as sick leave. However, the research suggests some services are using loopholes as a standard way of operating, rather than for emergencies. This leaves children at risk, without adequate supervision.
Increase staffing ratios to accommodate daily realities. These include child illness, breaks, hygiene and additional educational needs. The Productivity Commission has suggested 1:3 for babies, and we recommend 1:4 for toddlers and 1:8 for ages three to five. There also needs to be a “floater” – an educator who covers breaks and staff shortages.
Create funded cleaning and administrative positions. This would improve educators’ status and job satisfacton, allowing them to use their training to educate and care for children.
Tighten the rules. Make sure staffing rules reflect the rooms in which children belong, including only those staff actively working with the children.
Policymakers and the community rightly expect services to strengthen safety. But unchanged ratios leave educators responsible for delivering more under the same minimum staffing rules. This can lead to educator burnout and attrition. Educators need real support to ensure they are in turn, supporting children and families.
Thames Coromandel District Council is urgently asking people not to swim, fish or collect shellfish in the area around where the stream discharges until further notice.Supplied / Thames Coromandel District Council
Thames Coromandel District Council says a sinkhole has formed near the Onemana Wastewater Treatment Plant.
In a post online the council says it suspects treated wastewater may have entered a local wetland, potentially entering a stream that flows to the beach.
It says the sinkhole is on private property near the wastewater treatment plant’s subsurface irrigation field.
Onemana is a coastal community on the Coromandel Peninsula, north of Whangamata.
“As a proactive step, we are erecting signage by the Onemana Drive Carpark advising people not to swim, fish or collect shellfish in the area around where the stream discharges until further notice,” it said.
The council said it was turning off the irrigation disposal that is closest to the sinkhole, carrying out water sampling and would monitor the site to ensure no further deterioration or land movement.
This plan will decimate hotels across South Australia, wiping out many of the 26,000 jobs it directly creates.
Australian Hotels Association (South Australia) chief executive Ian Horne, quoted in The Guardian, February 21, 2018
… a majority of pub employees (over 26,000 in SA!) will likely lose their jobs.
Letter signed by the McCallum family, owners of The Lonsdale Hotel, February-March, 2018
SA Best leader Nick Xenophon has said that if his party wins the balance of power in this Saturday’s South Australian state election, poker machine reform would be “a key issue in any negotiations” about the formation of the next government.
Among other reforms, Xenophon has proposed a reduction in the number of poker machines in some pubs by 50% over five years, and the introduction of a $1 maximum bet per spin for machines in all venues other than the Adelaide casino.
The South Australian branch of the Australian Hotels Association (AHA SA), led by chief executive Ian Horne, says the SA Best policy would “decimate hotels across South Australia, wiping out many of the 26,000 jobs it directly creates”.
A letter signed and shared by the owners of one Adelaide hotel went further, saying “a majority” of 26,000 South Australian pub employees would “likely lose their jobs”.
Is that right?
Checking the source
In response to a request for sources to support the claim made in the Lonsdale Hotel letter, Keith McCallum referred The Conversation to the AHA SA.
A spokesperson for the AHA SA pointed The Conversation to a February 2018 newsletter from Ferrier Hodgson Adelaide partner David Kidman, and the ‘No Way Nick’ website, authorised by AHA SA chief executive Ian Horne.
The Conversation asked the AHA spokesperson to quantify what the association meant by “many” jobs, but did not receive a response to that question.
Verdict
The claim made by Australian Hotels Association of South Australia that proposed poker machine reforms would wipe out “many of the 26,000 jobs” in the South Australian hotel industry appears to be grossly exaggerated.
The Australian Hotels Association did not provide modelling or evidence to show how “many” jobs might be affected.
The number of gaming related jobs in South Australian hotels in 2015 was around 3,000. In the same year, less than 20% of the South Australian hotel industry’s revenue came from gaming.
The reforms proposed by SA Best aim to reduce the number of poker machines in some hotels, and reduce maximum bet limits, rather than removing the machines entirely.
Based on these factors, the Australian Hotels Association claim greatly overstates potential job losses.
In addition, at least some of the money not spent on poker machines would be spent on other recreational activities.
This means that potential job losses due to poker machine reforms may be partially offset by increases in employment elsewhere in the economy – or even within the same hotels.
What changes is SA Best proposing?
Among a suite of reforms, the SA Best party wants to reduce the number of poker machines in pubs with 10 or more machines by 10% each year over the next five years. This reduction wouldn’t apply to not-for-profit community clubs or the Adelaide Casino.
SA Best is also proposing the introduction of a $1 maximum bet per spin and a maximum win of $500 for machines in pubs and and not-for-profit community clubs.
SA Best leader Nick Xenophon said these reforms would reduce the number of poker machines in South Australia from around 12,000 to around 8,000, and reduce potential personal losses on pokies in pubs and community clubs from around $1,200 an hour to around $120 per hour.
The policy includes a poker machine buyback scheme, a “jobs fund” to assist affected employees, and the possibility of compensation for smaller poker machine operators.
Would ‘many of 26,000 jobs’ be wiped out?
First of all, let’s look at how many people work in the hotel industry in South Australia, and how many of those jobs are related to gaming.
This information is not available from the Australian Bureau of Statistics.
However, in January 2016, the South Australian Centre for Economic Studies published a report that examined the economic contribution of the hotel industry in South Australia.
The report was commissioned by the AHA SA, but it adopts a sound statistical approach to measuring employment in the hotel sector.
According to that report, a total of 26,250 staff were employed in hotels in South Australia in 2015. Of those, 3,048 were classified as gaming staff (or 11.6% of total employment).
Of the 26,250 people employed across the industry, the majority were casual staff (rather than permanent or part-time staff).
The SA Best proposal is to reduce poker machine numbers and maximum bets in some venues, as opposed to removing pokies entirely. So it’s clear that not all 3,000 gaming staff would be at risk.
However, the AHA SA is arguing that reduced revenue from pokies would threaten other jobs.
According to the same report, in 2015, 17% of the South Australian hotel industry’s annual revenue came from gaming. Around 80% of revenue came from liquor sales, food and beverage sales and accommodation.
So even in light of reduced gaming revenue, assertions that “many” or “the majority” of 26,000 pub employees would be affected appear to be unsubstantiated.
Jobs may be shifted elsewhere
To understand what might happen if Xenophon’s proposed reforms were introduced, we need to take two factors into account.
On the one hand, if less money is spent on poker machines, then the number of hours requested to service gaming activities decreases. This could result in less demand for labour, and hence a potential reduction in the number of those roles.
On the other hand, money not spent on gaming could be redirected to other recreational activities – like going to cafes, restaurants and cinemas – or to the retail sector. This would mean that new jobs would be created in other parts of the economy.
Spending diverted to food and beverage sales and other forms of entertainment could also see new jobs created within the same venues.
Another report conducted in 2006 by the South Australian Centre for Economic Studies, commissioned by the South Australian Independent Gambling Authority, found that following the introduction of electronic gaming machines in South Australia, employment in hotels did increase.
However, most of this increase came at the expense of other businesses, like cafes and restaurants. This shows that there is a strong substitution effect in employment between gaming activities and other recreational activities.
Having been published in 2006, the exact numbers in the report are dated. But the qualitative argument is unlikely to have changed. This conclusion is also supported by more recent studies.
In summary, while some of the 3,000 gaming-related jobs in the hotel industry may be lost as a result of the proposed poker machine reforms, claims that “many” or “the majority” of 26,000 jobs would be lost are grossly exaggerated, and not supported by available evidence or existing research. – Fabrizio Carmignani
Blind review
I agree with the conclusions of this FactCheck.
The assertions that “a majority” or “many” of the 26,000 jobs in the South Australian hotel industry would be lost if the proposals put forward by SA Best were to be implemented are gross exaggerations.
They might not be quite as gross an exaggeration as the analogous assertions made in Tasmania during that state’s recent election campaign, but they are an exaggeration, nonetheless. – Saul Eslake
The Conversation is fact-checking the South Australian election. If you see a ‘fact’ you’d like checked, let us know by sending a note via email, Twitter or Facebook.
The Conversation FactCheck is accredited by the International Fact-Checking Network.
The Conversation’s FactCheck unit was the first fact-checking team in Australia and one of the first worldwide to be accredited by the International Fact-Checking Network, an alliance of fact-checkers hosted at the Poynter Institute in the US. Read more here.
Have you seen a “fact” worth checking? The Conversation’s FactCheck asks academic experts to test claims and see how true they are. We then ask a second academic to review an anonymous copy of the article. You can request a check at checkit@theconversation.edu.au. Please include the statement you would like us to check, the date it was made, and a link or a photo if possible.
The New Zealand Transport Agency’s decision to extend the Waikato-Auckland passenger rail service Te Huia is welcomed, Rail Minister Winston Peters says.
“Te Huia came into existence because we funded KiwiRail to refurbish the carriages and build a dedicated mechanical depot in Hamilton,” Mr Peters says.
“The five-year trial service was negatively impacted by the Covid-19 Auckland shutdowns in its first year, so a one-year extension is pragmatic and means a fair assessment can be given.
“This Waikato Regional Council’s service has received strong patronage, developed into a weekday commuter and weekend city connector, and has 98 percent customer satisfaction rates which are a credit to operator KiwiRail’s crews.
“We are pleased to see the service will continue,” Mr Peters says.
SINGAPORE – Media OutReach Newswire – 19 February 2026 – GLM-5, newly released as open source, signals a broader shift in artificial intelligence. Large language models are moving beyond generating code snippets or interface prototypes toward building complete systems and carrying out complex, end-to-end tasks. The change marks a transition from so-called “vibe coding” to what researchers increasingly describe as agentic engineering.
LLM Performance Evaluation: Agentic, Reasoning and Coding
Built for this new phase, GLM-5 ranks among the strongest open-source models for coding and autonomous task execution. In practical programming settings, its performance approaches that of Claude Opus 4.5, particularly in complex system design and long-horizon tasks requiring sustained planning and execution.
The model rests on a new architecture aimed at scaling both capability and efficiency. Its parameter count has expanded from 355bn to 744bn, with active parameters rising from 32bn to 40bn, while pre-training data has grown to 28.5trn tokens. These increases are paired with advances in training methods. A framework called Slime enables asynchronous reinforcement learning at a larger scale, allowing the model to learn continuously from extended interactions and improve post-training efficiency. GLM-5 also introduces DeepSeek Sparse Attention, which maintains long-context performance while cutting deployment costs and improving token efficiency.
Benchmarks suggest strong gains. On SWE-bench-Verified and Terminal Bench 2.0, GLM-5 scores 77.8 and 56.2, respectively, the highest reported results for open-source models, surpassing Gemini 3 Pro in several software-engineering tasks. On Vending Bench 2, which simulates running a vending-machine business over a year, it finishes with a balance of $4,432, leading other open-source models in operational and economic management.
These results highlight the qualities required for agentic engineering: maintaining goals across long horizons, managing resources, and coordinating multi-step processes. As models increasingly assume these capabilities, the frontier of AI appears to be shifting from writing code to delivering functioning systems.
Labour MP Kieran McAnulty was ordered to leave the House during a tense session that included many challenges on the Speaker’s rulings.
Question Time began with Gerry Brownlee indirectly rebuking New Zealand First leader Winston Peters for his remarks towards Green MP Teanau Tuiono on Wednesday, but stopping short of demanding an apology.
The situation meant tensions did not die down in Parliament, leading to McAnulty eventually being thrown out for accusing the Speaker of double standards.
On Wednesday, Peters took issue with a question line by the Green MP, after he referred to the country as Aotearoa in his primary question.
“Why is [the minister] answering a question from someone who comes from Rarotonga to a country called New Zealand…” Peters started, before being interrupted by noise from other MPs in the debating chamber.
At the time, Brownlee said he had not heard Peters’ remark.
Peters then completed his question, asking why somebody from Rarotonga had decided “without any consultation with the New Zealand people” to change the country’s name.
In response, Brownlee said that was not an acceptable question, and it would be the last time those sorts of questions were directed “so personally” to other members.
Speaker Gerry Brownlee.VNP / Phil Smith
Tuiono has both Māori and Cook Islands Māori heritage but was born in New Zealand.
On Thursday, Brownlee stood ahead of Question Time to rule on Wednesday’s incident, and said it was “highly disorderly” to question an elected member’s rights and privileges.
“Members who engage in such comment can expect to be ejected from the House. Such comments are not only disrespectful to the member concerned, but also to this House, and also disrespectful to the electors in the electoral process that allows members to sit in this House.”
While Brownlee said he undertook his review to Peters’ question, he did not refer to Peters directly in his ruling.
On Thursday, he again pointed members to that ruling.
“I would encourage members unfamiliar with it to become familiar with it. Further questioning of the ruling will be considered highly disorderly, with the usual consequences.”
In a lengthy back-and-forth, Labour MPs took issue with Brownlee’s decision not to take further action against Peters, particularly as he had said members who made such comments could be ejected.
Shadow Leader of the House Kieran McAnulty said at the very least, Peters should have been made to withdraw and apologise.
“In August last year, you required Chlöe Swarbrick to withdraw and apologise for comments that were made on the day prior. Now, at the time we expressed concern about that, because we felt in doing so, that was setting a precedent,” McAnulty said.
“But nevertheless, here we are again in a situation where you are saying that you are unable to require a member to withdraw and apologise for something that happened yesterday.”
McAnulty said it ran the risk of applying different standards to some but not others, a point Brownlee accepted, and said he would avoid in the future.
Labour MP Willie Jackson said he took “personal offence” to Peters’ comments, to which Brownlee asked why he did not raise that at the time.
Swarbrick also encouraged the Speaker to apply the same consistency, “lest you be accused of double standards”, a comment Brownlee said was “borderline trifling” with the chair.
Green MP Ricardo Menéndez March pursued a different line of questioning, relating to Peters’ assertion that Tuiono was from Rarotonga.
“Unless the former deputy prime minister was deliberately trying to mislead the House, I think a correction should be an order, because there was a factually incorrect statement being made about where he was born.”
Brownlee said Menéndez March was making a suggestion there had been a breach of privilege, and there were processes for dealing with that.
Eventually, Brownlee called the matter to a close, and Question Time began, but the matter was not settled for the opposition.
After Brownlee chastised Jackson for repeated interruptions, McAnulty raised a further point of order.
“It’s quite clear that Willie Jackson is on a warning that if he interrupts you again he’ll be sent out,” McAnulty began.
“No it’s not,” Brownlee said.
“OK, so he can carry on?” replied McAnulty, to which Brownlee warned him he would be trifling with the chair if he carried on.
“I’m concerned that just by that statement it’s quite clear that you’re saying that if I trifle with you again that I will leave, but you won’t even require someone making a racist comment to withdraw and apologise,” McAnulty said.
He was then ordered to leave the House.
Speaking on the tiles shortly afterwards, McAnulty repeated his belief the Speaker was applying double standards.
“Winston Peters is able to trifle with him, undermine him, make racist comments, make questionable comments, certainly unparliamentary comments and actions in the House, and there is no action against that,” he said.
“We challenged the Speaker today in a respectful and highly appropriate way, and yet I’m the one that gets kicked out. Proving my point, to be fair.”
He reiterated that Labour had lost confidence in the Speaker following his ruling there was no private benefit in an amendment paper that listed projects under the Fast Track bill.
Peters insisted Swarbrick’s situation was different, as she had been told to apologise and would not, and then when she came back the next day again refused to apologise.
“[McAnulty] was raising the parallel circumstance, which were not parallel,” he said.
Peters said he was not sorry for his comments towards Tuiono.
“You’re saying that we can change the name of the country without asking the New Zealand people? That’s fascist. That’s antidemocratic.”
Source: The Conversation (Au and NZ) – By Adrian Beaumont, Election Analyst (Psephologist) at The Conversation; and Honorary Associate, School of Mathematics and Statistics, The University of Melbourne
One Nation is just two points behind Labor in a Victorian state DemosAU poll, with the election in November. A federal Resolve poll has One Nation and the Coalition tied at 23% each with Labor well ahead.
The Victorian state election is in late November. A DemosAU and Premier National poll, conducted February 1–10 from a sample of 1,274, gave the Coalition 29% of the primary vote (down eight since an October DemosAU poll), Labor 23% (down three), One Nation 21% (not previously asked for), the Greens 15% (steady) and all Others 12% (down ten).
The Coalition led Labor by 53–47 after preferences, a two-point gain for the Coalition. Even if Labor fell below One Nation on primary votes, Greens preferences would boost them back ahead of One Nation.
On this poll’s results, the Coalition would be likely to win a majority of the 88 lower house seats against Labor, but One Nation would win some seats that would otherwise go to the Coalition. The result could be a Coalition government dependent on One Nation support.
Labor Premier Jacinta Allan was at net -37 favourable, with 53% giving her a negative rating and 16% positive. Liberal leader Jess Wilson was at net +3 (27% positive, 24% negative). Wilson led Allan as preferred premier by 40–31 (former Liberal leader Brad Battin had led by 40–32 in October).
Crime was rated the most important issue by 30%, followed by cost of living on 29% and housing affordability on 12%.
By the November election, Labor will have governed Victoria for the last 12 years and 23 of the last 27. An “it’s time” factor may explain some of Labor’s bad polling.
Upper house voting intentions were 28% Coalition (down two since October), 20% One Nation (up nine), 19% Labor (down two), 14% Greens (steady), 5% Legalise Cannabis (up three) and 4% Animal Justice (up one).
All 40 upper house seats will be up for election in November using eight five-member electorates by proportional representation with preferences. The Coalition and One Nation would be favoured to win a combined majority.
Also in Victoria, a byelection will be needed in Nepean after Liberal MP Sam Groth resigned. At the 2022 state election, Groth defeated Labor in Nepean by 56.4–43.6, from primary votes of 48.1% Groth, 32.6% Labor and 8.8% Greens.
Federal Liberal leadership change and Resolve poll
Last Friday Angus Taylor was elected new federal Liberal leader, defeating former leader Sussan Ley in a spill of Liberal MPs and senators by 34–17. Ley has said she will resign from parliament, setting up a byelection in her seat of Farrer.
At the 2025 federal election, Ley defeated independent Michelle Milthorpe in Farrer by 56.2–43.8. The Liberal vs Labor two-party vote in Farrer was 62.9–37.1 to Ley. Primary votes were 43.4% Ley, 20.0% Milthorpe, 15.1% Labor, 6.6% One Nation and 4.9% Greens. The Nationals are likely to contest the byelection, so the main contenders are One Nation, Milthorpe, the Liberals and the Nationals.
A national Resolve poll for Nine newspapers was conducted February 8–14 (in the days before and after the Liberal spill) from a sample of 1,800. It has been broken into a post-spill and pre-spill sample. The post-spill sample included pre-spill polling that asked how respondents would vote if Taylor replaced Ley.
A post-spill poll put the Coalition, under new leader Angus Taylor, tied with One Nation.FLAVIO BRANCALEONE/AAP
The post-spill sample gave Labor 32% of the primary vote (up two since the January Resolve poll), the Coalition 23% (down five), One Nation 23% (up five), the Greens 11% (up one), independents 6% (down one) and others 5% (down two). In the pre-spill sample, One Nation had led the Coalition by 25–20 with other parties’ support similar.
No two-party estimate was given, but applying 2025 election flows to the post-spill sample gives Labor nearly a 54–46 lead over the Coalition, a three-point gain for Labor since January.
Anthony Albanese’s net approval improved two points since January to -20, with 55% rating him poor and 35% good. In her final poll as Liberal leader, Ley’s net approval slumped 15 points to -23. Albanese led Ley as preferred PM by 38–22 (33–29 in January).
Pauline Hanson’s net likeability was +7, Liberal Andrew Hastie’s was +4, Taylor’s was +3, Nationals leader David Littleproud’s was -8 and Labor Energy Minister Chris Bowen’s was -8. On issues, 45% rated cost of living most important, with 10% for immigration.
The Liberals led Labor by 24–23 on keeping the cost of living low (29–26 in January). On economic management, there was a 26–26 tie (31–26 to the Liberals previously).
Pre-spill Morgan poll has Labor gaining
A national Morgan poll, conducted February 9–13 (before the Liberal spill) from a sample of 1,216, gave Labor 30.5% of the primary vote (up two since the February 2–8 Morgan poll), One Nation 25% (up 0.5), the Coalition 20% (down 2.5), the Greens 13% (down 0.5) and all Others 11.5% (up 0.5).
Labor led the Coalition by a blowout 58.5–41.5 on respondent preferences, a five-point gain for Labor. On 2025 election flows, Labor led by 55–45, a two-point gain for Labor. No Labor vs One Nation two-party estimate was reported.
Tasmanian DemosAU poll has Liberals down
A Tasmanian state DemosAU poll, conducted January 27 to February 12 from a sample of 1,071, gave the Liberals 35% of the primary vote (down six since an October DemosAU poll), Labor 23% (down one), independents 17% (up three), the Greens 15% (steady), the Shooters 4% (up two) and others 6% (up two). One Nation was not asked for as it is not yet a registered party in Tasmania.
Tasmania uses a proportional system so a two-party estimate is not applicable. Liberal Premier Jeremy Rockliff’s net approval slid three points to +2, while Labor leader Josh Willie’s net approval was down two points to -7. Rockliff led Willie as preferred premier by 43–32 (46–34 previously).
Other politicians listed were Liberal Treasurer Eric Abetz (-21 net approval), former Labor leader Dean Winter (-23) and Greens leader Rosalie Woodruff (-21). Winter’s net approval jumped ten points since October.
Upcoming UK byelection and US special elections
I wrote for The Poll Bludger last Thursday about a February 26 United Kingdom parliamentary byelection in a safe Labour seat and three United States federal special elections for the House of Representatives that will occur by August. Democrats are attempting to gerrymander Virginia’s 11 House districts for a 10–1 Democratic split.
South Australians head to the polls on March 21, with Premier Peter Malinauskas’s Labor Party on track to win by a landslide.
But while a predicted landslide in a state election would not normally garner deep national attention, the SA election will be closely watched this time as a microcosm of the changing dynamics of Australian politics.
The headline two-party preferred figure of 61–39% in favour of Labor is masking the broader splintering of the right side of politics. The Liberals are haemorrhaging votes to One Nation, which leads them on the primary vote by 20–19%.
Liberal woes
While the federal Liberals are suffering from leadership and coalition instability, the SA branch has its own systemic problems. The state Liberals have been a party of almost perpetual opposition, only forming government when Labor is plagued by scandal and longevity in office. The Liberals have only won five elections out of 17 since 1965.
SA does not have a coalition, as the Liberal and Country parties merged in 1932. There has been only sporadic Nationals representation in parliament, with the most recent Nationals MP, Karlene Maywald, controversially serving in the Rann Labor Cabinet from 2004–10.
Geography is a major contributor to Liberal electoral woes, with much of their vote traditionally being concentrated in rural and regional seats. One Nation is running candidates in all lower house seats, and would be most hopeful of picking up some of the more regional Liberal seats, such Hammond. Six of the Liberals’ 13 current seats might be under threat, along with two or three of the crossbench seats such as Mount Gambier.
More pointedly, the party has also long been bedevilled by factional infighting and the regular defection of rural members to the crossbench. These rural defectors have demonstrated an ability to “dig in” across usually safe Liberal seats. Rural and regional MPs disproportionately dominate the Liberal caucus, which skews its ability to appeal to more metropolitan seats.
The Liberals are suffering from leadership churn. Liberal leader Ashton Hurn, who was a media advisor to former Liberal Premier Steven Marshall, took over from Vincent Tarzia in December 2025. Tarzia had only served as leader since August 2024, having taken over from David Speirs, who was convicted for supplying a controlled substance.
Under this tumult, Labor consolidated its lead by picking up two crucial byelection wins in Dunstan and Black. The Liberals currently hold a nominal 13 of the 47 seats in the lower House – a record low. Current polling indicates they will lose more seats at the March election, and there is even a chance they will be left without a single lower house MP.
Opposition leader Ashton Kurn has been in the job since December 2025, and faces a monumental task at the state election.Abe Maddison/AAP
One Nation and the far right in SA
One Nation is a late entrant to SA politics, and has only elected one member, Sarah Game, to the Legislative Council in 2022. One Nation has historically been organisationally weak in the state – it even failed to register its candidates in time for the 2018 state election. Game subsequently resigned from the party in late 2025, following a preselection dispute with Hanson – a common occurrence in One Nation’s history.
Hanson recently announced former senator Cory Bernardi would head the party’s upper house ticket in 2026.
Bernardi served as a Liberal senator for SA in 2006–17, before forming the short-lived Australian Conservatives party between 2017–19. Sharing a similar Christian Conservative values base, the party merged with the pre-existing Family First party – a morality-focused conservative party with an enduring presence in SA politics.
Bernardi is a polarising figure with lower popularity in the state than Hanson. So there is a question about whether his conservative credentials will add to One Nation’s electoral support.
[embedded content]
One Nation’s prospects
The election campaign to date has been relatively uncontroversial, despite lingering issues of ambulance ramping, the algal bloom and the cancellation of the Adelaide Writer’s Week being potential weaknesses for the government. Malinauskas and Labor have been emphasising their “building” credentials, pointing to major infrastructure projects such as the North-South Corridor, and promising significant urban expansion.
Campaign activity has tended to be focused in Liberal-held seats. These range from urban marginals such as Morialta, Unley and Colton to usually more secure regional areas such as Ngadjuri, Hammond and Kavel, which are being encroached on by Adelaide’s urban sprawl.
The Liberals are struggling to offer a policy narrative. For example, there is confusion over their signature stamp duty policy, which has changed in the switch from Tarzia to Hurn.
The electoral conditions seem ideal for a One Nation surge. However, there are reasons to temper expectations. One Nation tends to poll most strongly in rural seats. Several rural electorates in SA already have independent incumbents, or high-profile independent candidates who have been in the field for months. This may complicate One Nation’s path to victory in these areas.
Crisis on the centre-right
The Malinauskas government is poised for an emphatic win on election night. Yet, the foundations of the results are grounded less in Labor’s policy record than in the deepening crisis of the centre-right in Australia.
In common with countries such as the United Kingdom, France, Sweden and Germany, there is a growing fragmentation of the right. A recent academic study of state politics shows how these dynamics play out in very specific and localised ways in Australia.
At the heart of this is an ideological splintering, with a more assertive conservative politics increasingly at odds with the more socially liberal but economically classical traditions. The SA result may offer insight into how deep this fracture is.
Source: The Conversation (Au and NZ) – By Kelsie Boulton, Senior Research Fellow in Child Neurodevelopment, Brain and Mind Centre, University of Sydney
When it comes to autism, few questions spark as much debate as how best to support autistic people with the greatest needs.
This prompted The Lancet medical journal to commission a group of international experts to propose a new category of “profound autism”.
This category describes autistic people who have little or no language (spoken, written, signed or via a communication device), who have an IQ of less than 50, and who require 24-hour supervision and support.
It would only apply to children aged eight and over, when their cognitive and communication abilities are considered more stable.
In our new study, we considered how the category could impact autism assessments. We found 24% of autistic children met, or were at risk of meeting, the criteria for profound autism.
Why the debate?
The category is intended to help governments and service providers plan and deliver supports, so autistic people with the highest needs aren’t overlooked. It also aims to re-balance their under-representation in mainstream autism research.
This new category may be helpful for advocating for a greater level of support, research and evidence for this group.
But some have raised concerns that autistic people who don’t fit into this category could be perceived as less in need and excluded from services and funding supports.
Others argue the category doesn’t sufficiently emphasise autistic people’s strengths and capabilities, and places too much emphasis on the challenges that are experienced.
What did we do?
We conducted the first Australian study to examine how the “profound autism” category might apply to children attending publicly funded diagnostic services for developmental conditions.
Drawing on the Australian Child Neurodevelopment Registry, we examined data from 513 autistic children assessed between 2019 and 2024. We asked:
how many children met the criteria for profound autism?
were there behavioural features that set this group apart?
Because we focused on children at the time of diagnosis, most (91%) were aged under eight years. We described these children as being “at risk of profound autism”.
What did we find?
Around 24% of autistic children in our study met, or were at risk of meeting, the criteria for profound autism. This is similar to the proportion of children internationally.
Almost half (49.6%) showed behaviours that were a safety risk, such as attempting to run away from carers, compared with one-third (31.2%) of other autistic children.
These challenges weren’t limited to children who met criteria for profound autism. Around one in five autistic children (22.5%) engaged in self-injury, and more than one-third (38.2%) showed aggression toward others.
So, while the category identified many children with very high needs, other children who didn’t meet these criteria also had significant needs.
Importantly, we found the definition of “profound autism” doesn’t always line up with the official diagnostic levels which determine the level of support and NDIS funding children receive.
In our study, 8% of children at risk of profound autism were classified as level 2, rather than level 3 (the highest level of support). Meanwhile, 17% of children classified as level 3 did not meet criteria for profound autism.
Our concern
We looked at children when they first received an autism diagnosis. Children were aged 18 months to 16 years, with more than 90% under the age of eight years.
This aligns with our earlier research, showing the average age of diagnosis in public settings is 6.6 years.
From a practical perspective, our biggest concern about the profound autism category is the age threshold of eight years.
Because most children are already assessed before age eight, introducing this category into assessment services would mean many families would need repeat assessments, placing additional strain on already stretched developmental services.
Second, modifications will be needed if this criteria is going to be used to inform funding decisions as it didn’t map perfectly onto level 3 support criteria.
On balance, however, our results suggest the profound autism category may provide a clear, measurable way to describe the needs of autistic people with the highest support requirements.
Every autistic child has individual strengths and needs. The term “profound autism” would need to be promoted with inclusive and supportive language, so as to not replace or diminish individual needs, but to help clinicians tailor supports and obtain additional resources when needed.
If you’re concerned your child requires substantial support, here are some practical steps you can take to ensure their needs are recognised and addressed:
Explain your concerns
Not all clinicians have experience working with children with high support needs. Be as clear as possible about behaviours that affect your child’s safety or daily life, including self-injury, aggression or attempts to run away. These details, while difficult to share, help give a clearer picture of your child’s support needs.
It can also be a challenge to find and access clinicians with appropriate expertise. Another potential benefit of having a defined category is that it can better help families navigate care.
Ask about support for the whole family
Our studies show that many caregivers want more support for themselves but don’t always ask. Talk with clinicians about supports for yourself as well, including respite, or family support groups.
Reach out
Coming together with other carers and families can reduce your own isolation and normalise many of the unique challenges you face. Connecting with like-minded people can provide a supportive, empathetic and empowering community.
Plan for safety
For children with high support needs, prioritise safety planning with your child’s care team. This can include strategies to reduce risks, as well as planning how best to support your child’s interactions with health, education and disability services over time.
The Conversation fact-checks claims made on Q&A, broadcast Mondays on the ABC at 9.35pm. Thank you to everyone who sent us quotes for checking via Twitter using the hashtags #FactCheck and #QandA, on Facebook or by email.
[embedded content]
Excerpt from Q&A, April 23, 2018.
What’s incredible when you look at those numbers is about 30% – it’s hard to tell often – about 30% of those homeless people have a job.
– Rebecca Huntley, social researcher and author, speaking on Q&A, April 23, 2018
Inequality, class and social mobility in Australia were key issues discussed on a recent episode of Q&A.
Social researcher and author Rebecca Huntley noted an uptick in the idea of “the undeserving poor” in Australia – particularly where homeless people are concerned.
Huntley noted the perception held by some that homeless Australians are simply “not working hard enough”.
Challenging that narrative, Huntley said “about 30% of those homeless people have a job”.
The definition of homelessness in the Census is probably broader than community perceptions about homelessness – that is, that all homeless people are sleeping rough on the streets.
People who are couch surfing or living in their car or living in overcrowded accommodation may well fit into this definition. They may also be working in the gig economy or getting work here and there (the double whammy of insecure work and insecure housing is quite terrible).
What the Census 2016 data show is that there are people with post compulsory education, with various levels of work and hours worked across all categories of people living in insecure housing arrangements.
Verdict
Based on the best available data, Rebecca Huntley’s statement that “about 30% of … homeless people have a job” is correct.
According to Census 2016 data, about 30% of people who were recorded as being homeless on Census night (using the Australian Bureau of Statistics definition of homeless) were also recorded as being in the work force.
What does it mean to be ‘homeless’?
When we talk about “homelessness”, many of us would think about people “sleeping rough” on the street. This is arguably the most severe and literal form of homelessness. But the state of being homeless is more complex than that.
Under the Australian Bureau of Statistics (ABS) definition, a person can be considered homeless if their current living arrangement:
is in a dwelling that is inadequate
has no tenure, or if their initial tenure is short and not extendable, or
does not allow them to have control of, and access to space for social relations.
The ABS presents its estimates of homelessness using these groupings:
People living in improvised dwellings, tents or sleeping out
People in supported accommodation for the homeless
People staying temporarily with other households
People living in boarding houses
People in other temporary lodgings, and
People living in “severely” crowded dwellings.
On the night of the 2016 Census, more than 116,000 people were counted as being homeless. This includes both children and adults. The estimates of the employment rate include only those age 15 and over.
This may be a conservative count, because some groups of people may be underenumerated (under counted) in the Census.
For example, the ABS notes that Aboriginal and Torres Strait Islander peoples’ are “more likely to be both underenumerated and over represented in the homeless population”, and that:
So called rough sleepers and people staying in supported accommodation for the homeless are also at risk of being underenumerated in the Census.
What constitutes ‘a job’?
In the Census data, people are counted as being employed if they are of working age (age 15 and over) and:
employed and working full-time
employed and working part-time, and/or
employed but away from work.
However, not all people age 15 and over who were experiencing homelessness were counted in the Census labour force statistics. For some people, no information was recorded.
Known employment rates for homeless people
If we calculate the known employment rate for homeless people (using the ABS definition of homelessness outlined above), we find that around 30% are employed, as Rebecca Huntley said on Q&A.
But the employment rate among homeless people could be higher.
That’s because we don’t have employment information for all homeless people. In the Census statistics, there are large numbers of people for whom information on employment status is missing, or not stated.
Overall, we don’t have records of the employment status of about 18% of the total homeless population.
Also, many people experiencing homelessness could be in situations where they wouldn’t be expected to work. For example, full-time students or the elderly.
This makes 30% likely to be the lower bound.
If we assume that the employment rate of those with missing information is the same as those with recorded information, the employment rate would increase to 36%. If we also excluded full-time students and the elderly from these statistics, the rate would be even higher.
Employment rate for people ‘sleeping rough’
“Sleeping rough”, or sleeping on the street, is arguably the most severe form of homelessness.
People sleeping rough are the group with the highest proportion of missing information on labour force status. The known employment rate for people sleeping rough is 10%.
If about half of the people with missing information were employed, the rate would go up to 30%. My assumption for this group is that most of those people with missing information are not employed.
So for those sleeping rough, the employment rate is probably closer to 10-15%.
The employment rate for people in supported accommodation is also likely to be around 10-15%. These two groups are those usually considered when a more literal definition of homelessness is used.
But as outlined in this FactCheck, the state of being “homeless” is more complex and wide ranging than that.
‘Journeys Home’ survey
Another useful data set on homelessness and employment is the Melbourne Institute’s Journeys Home survey, of which I was the Deputy Director.
This longitudinal survey, which began in 2011 and concluded in 2014, included 1,682 people in Australia flagged by Centrelink as either “homeless” or “at-risk of homelessness”.
The survey also included a group of income support recipients who were not flagged as homeless, but who had characteristics similar to those who had been homeless.
The overall rate of employment among all respondents was 27%. Of those who were homeless, 19% were employed.
In our study, however, we did not include those in overcrowded accommodation as being homeless. (These people are identified as being homeless in the Census).
This highlights the importance of the definition of “homelessness” used when considering the characteristics of the homeless population.
It’s also important to remember that just because someone isn’t employed doesn’t mean they don’t want to be employed, or aren’t seeking employment. Being homeless is a significant barrier to gaining – and retaining – a job. – Rosanna Scutella
Blind review
I agree with the verdict of this FactCheck that the overall rate of employment among people experiencing or being at-risk of homelessness is in the vicinity of 30%.
I would add that findings from my research using the Journeys Home data reveal that homelessness is more strongly associated with difficulty in retaining employment than with finding employment. – Neha Swami
The Conversation FactCheck is accredited by the International Fact-Checking Network.
The Conversation’s FactCheck unit was the first fact-checking team in Australia and one of the first worldwide to be accredited by the International Fact-Checking Network, an alliance of fact-checkers hosted at the Poynter Institute in the US. Read more here.
Have you seen a “fact” worth checking? The Conversation’s FactCheck asks academic experts to test claims and see how true they are. We then ask a second academic to review an anonymous copy of the article. You can request a check at checkit@theconversation.edu.au. Please include the statement you would like us to check, the date it was made, and a link if possible.
Source: The Conversation (Au and NZ) – By Samara McPhedran, Senior Research Fellow, Violence Research and Prevention Program, Griffith University
… the leading preventable cause of death and illness for women aged 18 to 44 is violence by a partner or former partner …
– Extract from an editorial in The Age, March 13, 2018
The latest available data shows that the top five causes of death, disability and illness combined for Australian women aged 15-44 years are anxiety and depression, migraine, type 2 diabetes, asthma and schizophrenia.
Violence (let alone the subset of family violence) doesn’t make the list.
– Statement published on the One in Three Campaign website, March 2018
Violence within intimate and domestic relationships in Australia is a serious social problem that has devastating consequences.
The statement that intimate partner violence or family violence is the leading preventable cause of death and illness for women aged between 15 (or 18) to 44, has been quoted by numerousmedia outlets and advocacy groups.
But the One in Three Campaign, an advocacy group focused on the male victims of family violence, says these statistics are misleading.
Who is correct?
Checking the sources
In response to The Conversation’s request for sources, a spokesperson for The Age pointed The Conversation to the website of the Victorian health promotion agency, VicHealth.
Australia’s National Research Organisation for Women’s Safety (ANROWS) did a follow-up report in 2016 using similar methodology, but on a national scale. The ANROWS report focuses on Australian women aged 18 to 44, which corresponds to The Age’s statement.
You can read the full response from The One in Three Campaign here.
Verdict
The Age editorial used the words “leading preventable cause of death and illness for women aged 18 to 44”. This is incorrect.
It’s important to make a distinction between cause and contributor to death and illness.
If The Age editorial used the words “contributor to”, it would be correct, i.e. “leading preventable contributor to death and illness for women aged 18 to 44”.
The findings, however, did not change a great deal between the 2003 and 2011 Australian Burden of Disease reports, in terms of the top causes of death, injury and illness.
If One in Three used the words “previous and current data shows”, and updated its reference, the claim would be correct.
While both of these claims are close to being correct, neither is complete.
Cause versus contributor
To give the full picture of how domestic violence is related to death, injury and illness, we need to look at causes of death, injury and illness, and the contributors to those causes.
If we were talking about lung disease, for instance, we would treat that as a “cause” of illness, but we would also consider whether a person was a heavy smoker (a contributor).
Likewise, if we were to look at the number of people whose deaths were due to type 2 diabetes (the cause), we would be interested in knowing whether those people had an unhealthy diet (a contributor).
Intimate partner violence can be treated as either a cause of death, injury and illness in its own right (as a subset of violence), or a contributor to other causes, such as depression and anxiety.
Intimate partner violence can be a leading contributor to death, injury and illness among women, without being among the leading causes. Looking at it from one perspective alone doesn’t provide a complete picture.
The claim by the One in Three Campaign is based on the AIHW Australian Burden of Disease Study 2003. This looks at the burden of death, injury and illness for all Australians, as well as providing breakdowns by age and sex.
The 2003 AIHW report is not the latest available data but the more recent Australian Burden of Disease Study 2011 contains basically the same results, in terms of the top causes of death, injury and illness.
The report used a range of data sources to look at different types of death, injury and illness, and considered how each of those contributed to the total “burden of disease”.
The “burden of disease” is based on a calculation of the number of years lost across a specified population due to premature death and years of “healthy” life lost due to disability arising from injury or illness. These years are called “disability-adjusted life years”.
According to that report, intimate partner violence was not among the top causes of death for women. Homicide and violence is the 26th highest cause of death, disability and illness.
The One in Three Campaign talked about the top five causes of death, disability and illness. The illnesses they referred to were the leading causes of “disability-adjusted life years”.
So this claim is about intimate partner violence as a cause of death, injury and illness rather than as a contributor to other causes.
It is important to note, however, that the 2003 AIHW report also estimated the contribution of intimate partner violence to the development of burdens such as depression and anxiety.
The report found intimate partner violence to be a leading risk for the development of depression and anxiety.
contributes more to the [disease] burden than any other risk factor in women aged 18-44 years, more than well known risk factors like tobacco use, high cholesterol or use of illicit drugs.
The ANROWS report draws very strongly on methods and data used in the AIHW Australian Burden of Disease Study 2011, and focuses on intimate partner violence victimisation as a risk factor for death and other outcomes, such as mental and physical illness.
In other words, The Age claim is based on a report looking at the contribution of intimate partner violence to other causes of death, injury and illness – rather than as a cause in itself.
The report suggests intimate partner violence contributes to around 5.1% of the total “burden of disease” among women aged 18-44, making it the largest single contributor to the “burden of disease” for that group of women.
The estimates reported are generally similar to other estimates (including those provided by AIHW reports) in terms of the magnitude of the burden, the diseases contributing to it and its ranking among other risk factors.
However, they may be slightly different due to the ANROWS report using a broad definition of intimate partner violence which includes emotional, as well as physical, abuse.
Both claims rest on information drawn from very similar sources: the AIHW Burden of Disease Study 2011 and the previous study from 2003. Although all datasets and methods come with caveats and cautions, there is no reason to believe that those sources are inaccurate.
The inconsistency between the claims arises from different ways of looking at the question, and different interpretations of essentially the same data.
Based on the reports above, a more accurate thing to say is that although intimate partner violence is not a leading cause of death, injury and illness among Australian women aged 18-44, it does appear to be a leading contributor. – Samara MacPhedran
Blind review
I agree with the conclusions of this FactCheck. It is a balanced examination of the alternative claims about the impact of domestic violence on women’s health, and highlights the differences in the direct claims of causation, as against the more indirect claims of contribution.
The FactCheck also rightly highlights that the definition of domestic violence has been expanded widely to move beyond physical violence, to capture more abstract forms such as emotional, psychological and financial abuse. – Terry Goldsworthy
* This article has been updated after publication to clarify the data in the first chart.
The Conversation FactCheck is accredited by the International Fact-Checking Network.
The Conversation’s FactCheck unit is the first fact-checking team in Australia and one of the first worldwide to be accredited by the International Fact-Checking Network, an alliance of fact-checkers hosted at the Poynter Institute in the US. Read more here.
Have you seen a “fact” worth checking? The Conversation’s FactCheck asks academic experts to test claims and see how true they are. We then ask a second academic to review an anonymous copy of the article. You can request a check at checkit@theconversation.edu.au. Please include the statement you would like us to check, the date it was made, and a link if possible.
Source: The Conversation (Au and NZ) – By Dylan McConnell, Researcher at the Australian German Climate and Energy College, The University of Melbourne
The Conversation fact-checks claims made on Q&A, broadcast Mondays on the ABC at 9.35pm. Thank you to everyone who sent us quotes for checking via Twitter using hashtags #FactCheck and #QandA, on Facebook or by email.
[embedded content]
Excerpt from Q&A, March 19, 2018.
Now, the consequence of [Jay Weatherill’s] policies was that South Australians faced the highest electricity charges, the highest retail electricity charges, in the country.
– Minister for Urban Infrastructure and Cities Paul Fletcher, speaking on Q&A, March 19, 2018
During an episode of Q&A, Minister for Urban Infrastructure and Cities Paul Fletcher said that South Australia has the “highest retail electricity charges in the country”. That statement in itself is correct.
But Fletcher went on to say that the high prices were “the consequence” of former SA Premier Jay Weatherill’s renewable energy policies, which included the introduction of a 50% renewable energy target, met in 2017.
Was Fletcher right?
Checking the source
In response to a request for sources and comment, a spokesperson for Fletcher pointed The Conversation to the Australian Energy Market Commission’s 2017 Residential Electricity Price Trends report, wholesale electricity price data from the Australian Energy Market Operator, and a 2017 Australian Competition and Consumer Commission report, which stated that:
… the combination of significant network investment over the past decade, recent increases to gas prices, more concentrated wholesale markets, and the transition from large scale synchronous generation to variable and intermittent renewable energy resources has had a more pronounced effect on retail prices and number of offers in South Australia than any other state in the National Electricity Market.
You can read the full response from Fletcher’s office here.
Verdict
Paul Fletcher was correct to say that South Australia has the highest retail electricity prices in Australia.
Current prices for the typical South Australian customer are 37.79 cents per kilowatt-hour (c/kWh). The Australian Capital Territory has the lowest retail electricity prices in Australia, at around 23.68 c/kWh.
But there are many factors that affect retail electricity prices. Increasing levels of renewable energy generation is just one.
Other factors include network costs, gas prices, changes in supply and demand dynamics and market competition issues.
Therefore, Fletcher’s assertion that South Australia’s high retail electricity prices are “the consequence” of former Premier Jay Weatherill’s renewable energy policies is incorrect.
Does South Australia have the highest retail electricity prices in the nation?
First, a quick terminology reminder. “Energy” is a broad term that includes sources such as petrol, diesel, gas and renewables, among other things. “Electricity” is a specific form of energy that can be produced from many different sources.
The “retail electricity price” is what you’ll typically see in your home electricity bill, and is usually expressed in cents per kilowatt-hour (c/kWh).
According the Australian Energy Market 2017 Residential Electricity Price Trends report, South Australia does indeed have the highest retail prices in the nation. Current prices for the typical South Australian customer are 37.79c/kWh.
The lowest retail electricity prices in the country are in the Australian Capital Territory, where the typical customer pays around 23.68c/kWh.
The retail electricity price includes the wholesale price of the electricity, the network costs (or the “poles and wires” that bring the electricity to your home), retailing costs, and levies related to “green schemes” (such as the renewable energy target or solar feed-in tariffs).
The chart below shows how the different components contributed the electricity price increase in South Australia between 2007-08 and 2015-16.
For many years the drivers for retail prices have been network costs – which have very little to do with renewables.
But over the past 18 months, there has also been a increase in wholesale electricity prices across the entire National Electricity Market – the interconnected power system that covers Queensland, New South Wales, the Australian Capital Territory, Victoria, South Australia and Tasmania.
A range of factors have contributed to this.
These include the increase in gas prices, and the tightening of the supply-demand balance.
The ACCC is also investigating “transfer pricing” – which is when a business that’s an energy generator as well as a retailer shifts costs from one part of its business to another.
Are the prices ‘the consequence’ of Weatherill’s renewable energy policy?
No. Even if wholesale prices become the main driver of retail prices, it’s not accurate to place the blame squarely on renewables.
Increased renewable energy generation may have contributed to decisions for some power plants to close. But so would other factors – such the A$400 million safety upgrade required for the Hazelwood power plant to have stayed open.
As mentioned above, other factors such as gas prices and competition issues have also contributed to increases in wholesale electricity prices. And as shown below, these are not confined to South Australia.
So, Fletcher was not correct to say that South Australia’s high electricity prices are “the consequence” of Weatherill’s renewable energy policies.
Indeed, a large proportion of the existing renewable investment in South Australia has been financed as a result of the federal Renewable Energy Target, introduced by the Howard government, rather than state policy. – Dylan McConnell
Blind review
I agree with the verdict.
The price question is not contentious. South Australia has the highest retail electricity prices in Australia.
But no single factor or decision is responsible for the electricity prices we endure today.
The Conversation FactCheck is accredited by the International Fact-Checking Network.
The Conversation’s FactCheck unit was the first fact-checking team in Australia and one of the first worldwide to be accredited by the International Fact-Checking Network, an alliance of fact-checkers hosted at the Poynter Institute in the US. Read more here.
Have you seen a “fact” worth checking? The Conversation’s FactCheck asks academic experts to test claims and see how true they are. We then ask a second academic to review an anonymous copy of the article. You can request a check at checkit@theconversation.edu.au. Please include the statement you would like us to check, the date it was made, and a link if possible.
Source: The Conversation (Au and NZ) – By Helen Barrie, Deputy Director of the Australian Migration and Population Research Centre, University of Adelaide
Nick Xenophon: The key issue here – and what I find most galling and emblematic of what is wrong – is we now have fewer young people in South Australia than we did 36 years ago, when our population was 400,000 fewer.
Jay Weatherill: And Nick – you’ve done it before. You’ve said that there are fewer young people here than there were in 1982. You know what you need to do to actually reach that conclusion?
You take the high point in 1981 – it falls all the way to 2002. Since 2002 to now, it’s grown by 36,000.
Sure, it’s less than 1981-82 now, but you have to ignore the fact that, under the entire life of this government, it has actually grown, the number of young people has grown.
– SA Best leader Nick Xenophon and Premier Jay Weatherill, speaking at the SA Votes: Leaders’ Debate, Adelaide, March 5, 2018
In a leaders’ debate ahead of the South Australian election, Premier Jay Weatherill and SA Best leader Nick Xenophon disagreed over the extent to which young people were leaving the state in search of better opportunities.
Xenophon claimed that “we now have fewer young people in South Australia than we did 36 years ago, when our population was 400,000 fewer”.
Weatherill agreed that there are fewer young people in South Australia now than there were in 1981-82, but said that in quoting that figure, Xenophon had ignored “the fact that, under the entire life of this [Labor] government … the number of young people has grown”.
Were the leaders right? And what’s behind these trends?
Checking the sources
In response to a request for sources and comment, a spokesperson for Xenophon pointed The Conversation to the 2017 Deloitte report Shaping Future Cities: Make it big Adelaide, which states:
Fewer people aged between 15 and 34 live in South Australia today than in the mid-1980s, despite the fact that the population has increased by around 340,000 people in that time.
The claim Xenophon made during the debate echoed a quote from an SA Best policy document, which states that there are “fewer young people – 18-to-34 year olds – living in South Australia today than 35 years ago”, and that this is “emblematic of the state’s decline”. So we’ll take 18-34 as Xenophon’s reference point.
A spokesperson for Jay Weatherill referred The Conversation to a 2018 report from the South Australian Centre for Economic Studies, and pointed to Australian Bureau of Statistics data showing that in the 0-24 age group, there was a decrease of 53,395 people between 1982 and 2002, followed by an increase of 36,742 people between 2002 (when Labor was returned to office under) and June 2017.
You can read the full response from Weatherill’s spokesperson here.
Verdict
During a South Australian leaders’ debate, SA Best leader Nick Xenophon and Premier Jay Weatherill provided different narratives about youth population trends.
Xenophon said “we now have fewer young people in South Australia than we did 36 years ago, when our population was 400,000 fewer” – a statistic he said was “emblematic” of employment issues in the state.
Both leaders used different definitions of “young people”.
Using SA Best’s own definition, Xenophon was incorrect. There were more people aged 18 to 34 in South Australia in 1982 than today. However, based on Weatherill’s definition (people 0 to 24 years), and another relevant definition (people 15 to 24 years), Xenophon’s statement is correct.
Weatherill was correct to say that since 2002, “under the entire life of this [Labor] government … the number of young people has grown”.
The proportion of young people in South Australia’s total population (across all three definitions) has declined since the early 1980s, but the decline has slowed since 2002.
However, none of the numbers are a simple reflection of the failure or success of government policies. There are also a number of longer term economic and social trends at play.
How do we define ‘young people’?
There’s no single definition of “young people” – and as you would expect, different definitions provide different outcomes.
During the campaign, the relevant policy document from Xenophon’s SA Best party described “young people” as being between the ages of 18 and 34.
Weatherill used a definition of young people as those aged between 0 and 24. (Keeping in mind that young people aged 0-17 are unlikely to leave the state of their own accord).
Each leader chose to highlight the numbers that best supported their own narrative.
Another way of examining this issue is to look at young people aged 15-24.
This is an age when many young people become independent, and may move away from South Australia to finish their education or find employment.
So here are the age ranges we’ll be looking at:
0-24 year olds (Weatherill’s definition)
15-24 year olds (highly mobile demographic), and
18-34 year olds (Xenophon’s definition).
Did the leaders quote their numbers correctly?
Xenophon said “we now have fewer young people in South Australia than we did 36 years ago, when our population was 400,000 fewer”.
According to Census data, South Australia’s population in 1981 was 1,285,042. In 2016, the Census recorded 1,676,653 people – a difference of 391,611.
Given that Xenophon was speaking in a live debate, rounding this number up to 400,000 is understandable.
In 1982, there were around 378,000 people aged 18-34 in South Australia, compared to just over 390,000 in 2017. In terms of raw numbers, that’s an increase of around 12,000 people. So on those calculations (using his own definition), Xenophon was incorrect.
However, based on the numbers for 0 to 24 year olds (Weatherill’s definition), and 15 to 24 year olds, Xenophon’s statement is correct.
The proportion of 18-34 year olds also fell from around 28% of the total population in 1982, to around about 23% in 2017.
Do Weatherill’s numbers stack up?
Weatherill pointed to 1981 as being a “high point” in youth population in South Australia.
It’s true that in the early 1980s, youth population numbers and youth as a proportion of the total population were higher.
It’s also true that the raw numbers of young people in South Australia then declined until the early 2000s. As the first chart in this FactCheck shows, after 2002 there was growth in the numbers of young people across all three definitions.
(Labor was returned to office in 2002, led by Mike Rann. Weatherill became premier in 2011.)
So, in terms of raw population numbers, Weatherill was correct to say that “under the entire life of this government … the number of young people has grown”.
Using Weatherill’s own definition (0-24 year olds), there was an increase of 36,742 people (in line with his original quote of 36,000).
The proportion of young people across all three definitions has declined since the early 1980s (though that decline has slowed since 2002).
Interestingly, as the chart shows, the decline in the proportion of 0-24 year olds has been greater than the proportions of the 15-24 and 18-34 cohorts, which have stayed relatively static under the four terms of the Labor government.
This is where the numbers tell us a new story – the biggest decline has been in the proportion of younger children. This suggests that falling fertility rates may have been a driver.
As you can see from the chart below, total fertility rates in South Australia did fall between 2008 and 2016.
What’s driving these trends?
The leaders were discussing these numbers in the context of the viability of South Australia as a place where young people can find work and affordable housing, and preventing the so-called “brain drain” that occurs when young people leave the state in search of opportunities elsewhere.
During the debate, Xenophon (and SA Liberal leader Steven Marshall) painted a picture of increasing numbers of young people leaving South Australia, while Weatherill told the story of youth population growth “under the entire life of this [Labor] government”.
None of the numbers are a simple reflection of the failure or success of government policies that may help to retain youth populations. There are larger historical trends at play.
Understanding the ‘Baby Boomer’ effect
We cannot fully understand why South Australia had more young people in the 1980s and 1990s than it does today without looking back to the postwar period of 1946 to 1964 – the years when the “Baby Boomer” generation was born.
The baby boom was particularly pronounced in South Australia, and coincided with a strong manufacturing sector that attracted young people from other states, and migrants during a period of high immigration rates (migrants also tend to be young).
This convergence meant that the early 1980s was a unique time in South Australian population trends.
The first wave of the Baby Boomers (born in the late 1940s and early 1950s) were having children, and those children would have been counted in the 1981 Census. At the same time, the late cohort of Baby Boomers (those born in the late 1950s and 1960s) would still have been included in the 20-24 year old Census cohort.
This was followed by a “baby bust”, or falling fertility rate. From a peak in the early 1960s, family sizes declined, reflecting national trends.
Economic factors are also at play
A number of economic events that took place in the early 1990s also had an impact on South Australia’s population profile.
A 2018 report published by the South Australian Centre for Economic Studies (SACES) noted that, in addition to the national recession, South Australia was affected by:
the loss of headquartered companies around the same time, and
the loss of “mass manufacturing” employment, which began in the 1980s and accelerated in the early 1990s.
The SACES report found that between 1993-94 and 2001-02, South Australia’s population growth was affected by “sharply reduced overseas immigration and increased outward migration to interstate”. The authors added that:
The dominant cohorts of those who left South Australia were young people and young families.
They did not return and they married and/or had children adding to other states’ younger aged profile while depleting our own.
It would be interesting to see how the numbers of international students in South Australia affect the composition of youth populations. People on student visas who are residents of South Australia are captured in Census data, but the data we need to properly analyse this factor are not readily available. – Helen Barrie
Blind review
The author offers a sound consideration of the available evidence.
The proportion of young people in South Australia has declined since the early 1980s – whether defined as those aged 0-24, 15-24, or 18-34 years.
Despite the decline in the proportion of young people, population momentum means that the South Australian population is still growing, albeit not as strongly as the Australian population overall. – Liz Allen
The Conversation thanks Liz Allen for providing the data used to create the charts in this FactCheck.
The Conversation FactCheck is accredited by the International Fact-Checking Network.
The Conversation’s FactCheck unit was the first fact-checking team in Australia and one of the first worldwide to be accredited by the International Fact-Checking Network, an alliance of fact-checkers hosted at the Poynter Institute in the US. Read more here.
Have you seen a “fact” worth checking? The Conversation’s FactCheck asks academic experts to test claims and see how true they are. We then ask a second academic to review an anonymous copy of the article. You can request a check at checkit@theconversation.edu.au. Please include the statement you would like us to check, the date it was made, and a link if possible.
Source: The Conversation (Au and NZ) – By Dylan McConnell, Researcher at the Australian German Climate and Energy College, The University of Melbourne
Look, this is probably the single most important issue to most households in South Australia — what they’ve been left with now are the highest energy prices in Australia — some say in the world — and the least reliable grid.
And it’s all because this government decided we had to go headlong into intermittent renewable energy without the baseload to support that transition.
– SA Liberal Party leader Steven Marshall, speaking at the SA Votes: Leaders’ Debate, Adelaide, March 5, 2018
Electricity prices and the reliability of South Australia’s energy grid will be key issues for voters in this Saturday’s state election.
During a public leaders’ debate, SA Liberal Party leader Steven Marshall claimed that, under the Weatherill Labor government, South Australians had been left with “the highest energy prices in Australia – some say in the world – and the least reliable grid”.
Marshall said this was “all because this [Labor] government decided we had to go headlong into intermittent renewable energy without the baseload to support that transition”.
Let’s look at the evidence.
Checking the source
A spokesperson for Marshall told The Conversation that when the opposition leader said energy prices, he was referring to retail electricity prices.
To support Marshall’s statement, the spokesperson provided The Conversation with two2017 documents from the Australian Energy Market Operator, one 2015 document from the Australian Energy Regulator, a letter from the Essential Services Commission of South Australia (ESCOSA) to the SA Minister for Energy Tom Koutsantonis, and a 2017 article from the Australian Financial Review.
Regarding the reliability of South Australia’s grid, the spokesperson said the Australian Energy Market Operator’s Electricity Statement of Opportunities shows that “in 2017-18 South Australia has the highest percentage of unserved energy at 0.0025%”, adding that “the reliability standard is 0.0020%”.
You can read the full response from Marshall’s office here.
Verdict
SA Liberal Party leader Steven Marshall said South Australia has “the highest energy prices in Australia — some say in the world”.
It’s true that South Australia has the highest retail electricity prices in Australia (although not in the world).
Marshall also said South Australia has the “the least reliable grid”.
In the energy industry, the word “reliability” means having enough energy generation capacity and inter-regional network capacity to supply customers.
The Australian Energy Market Operator is currently preparing estimates of unserved energy (the measure of reliability) for 2016-17. It is possible that there will be unserved energy for South Australia over this period.
However, it’s far from clear that South Australia would have had the highest level of unserved energy in the National Electricity Market.
People in South Australia do experience interruptions to their electricity supply.
But more than 97% of these are due to distribution outages (caused by things like trees falling on power lines) and are unrelated to the source of electricity – renewable or otherwise – flowing through the power lines.
There are many factors that affect electricity prices, grid reliability and power outages. Increasing levels of renewable energy generation is one factor.
Therefore, Marshall’s assertion that these outcomes are “all because this [Labor] government decided we had to go headlong into intermittent renewable energy without the baseload to support that transition” is incorrect.
Responding to the sources
The sources provided by Marshall’s spokesperson are from reputable government agencies. However, it’s far from clear that the sources support the conclusions Marshall drew in the leaders’ debate.
For example, the spokesperson cited an Australian Energy Market Operator (AEMO) report stating that South Australia would breach the regulator’s reliability standard in 2017-18.
But this is a projection, and doesn’t include some measures that have already been taken to ensure that the grid is reliable in 2017-18.
You can read more analysis of the sources provided by Marshall’s office here.
‘Energy’ vs ‘electricity’ prices
In making his statement, Marshall referred to “energy” prices. Energy and electricity prices are different things. Marshall’s spokesperson later told The Conversation that the MP was referring to “household electricity prices”.
Energy is a broad term that includes sources such as petrol, diesel, gas and renewables, among other things. Electricity is a specific form of energy that can be produced from many different sources.
The retail electricity price is what you’ll typically see in your home electricity bill, and is usually expressed in cents per kilowatt-hour (c/kWh).
Does South Australia have the highest retail electricity prices in the nation?
According the Australian Energy Market 2017 Residential Electricity Price Trends report, South Australia does indeed have the highest retail prices in the nation. Current prices for the typical SA customer are 37.79c/kWh.
According to that report, the Australian Capital Territory has the lowest retail electricity prices in Australia, at around 23.68 c/kWh.
The retail electricity price includes the wholesale price of the electricity, the network costs (or the “poles and wires” that bring the electricity to your home), retailing costs, and levies related to “green schemes” (such as the renewable energy target or solar feed-in tariffs).
The chart below shows how the different components contributed the electricity price increase in South Australia between 2007-08 and 2015-16.
For many years the drivers for retail prices have been network costs – which have very little to do with renewables.
But over the past 18 months, there has also been a increase in wholesale electricity prices across the entire National Electricity Market. A range of factors have contributed to this. These include the increase in gas prices, and the tightening of the supply-demand balance.
The ACCC is also investigating “transfer pricing” – which is when a business that’s an energy generator as well as a retailer shifts costs from one part of its business to another.
But as I’ll explain below, even if wholesale prices become the main driver of retail prices, it’s not accurate to place the blame squarely on renewables.
Does South Australia have the highest retail electricity prices in the world?
Because of differences in tax structures and energy systems, it’s no simple matter to compare energy and electricity prices between countries.
A 2017 Australian Competition and Consumer Commission report compared retail electricity prices among countries in the Organisation for Economic Co-operation and Development (OECD).
Australian prices were in the lower end of the range, but above the OECD total. While SA prices are above the Australian national average, they would still not be the most expensive in the OECD on a purchasing power parity basis.
Does South Australia have the ‘least reliable grid’?
In the context of energy supply, the word “reliable” will mean different things to different people.
The Australian Energy Market Commission defines “reliability” as having sufficient generation, demand side response, and interconnector capacity in the system to generate and transport electricity to meet consumer demand.
Under this definition, the National Energy Market meets a reliability standard as long as the maximum expected amount of “unserved energy” in any region doesn’t exceed 0.002% of the region’s annual energy consumption.
“Unserved energy” means the amount of customer demand that can’t be supplied within a region of the National Electricity Market, specifically due to a shortage of generation or interconnector capacity.
Marshall’s office did refer The Conversation to the AEMO’s Electricity Statement of Opportunities, which predicts South Australia’s unserved energy over 2017-18 at 0.0025%, just above the reliability standard.
However, and crucially, these projections do not include the new state-owned diesel generators (which can provide up to 276 megawatts) among other things. And these projections are made in order for the market to respond, and prevent the shortfall from occurring.
Between 2010-11 and 2015-16, the amount of unserved energy in the National Electricity Market was zero.
AEMO is currently preparing estimates of unserved energy for 2016-17. It is possible that there will be unserved energy for South Australia over this period.
However, it’s far from clear that South Australia would have had the highest level of unserved energy.
In fact, AEMO directed more load-shedding in New South Wales than South Australia on proportional basis. If this load-shedding were to be considered unserved energy, then New South Wales may technically have been less reliable.
Then why has South Australia had so many blackouts?
The technical definition above might not be of much comfort to South Australians experiencing power outages.
The average South Australian experienced 970 cumulative minutes of blackout in 2016-17. This was extraordinarily high due to the statewide blackouts in September 2016 caused by extreme weather. In 2015-16, the average total was 173 minutes.
But across the National Electricity Market the vast majority of these – over 97% – are due to distribution outages, which can be caused by anything from trees falling on power lines to “possum flashovers”. These occur regardless of the source of electricity flowing through the power lines.
Sources of supply interruptions in the NEM: 2007-08 to 2015-16.AEMC 2017, Reliability Frameworks Review, Interim Report (page 54)
South Australia may have the highest number of supply interruptions, but this is essentially unrelated to electricity supply mix.
Is this ‘all because’ of state Labor policy?
No. Even if wholesale prices become the main driver of retail prices, it’s not accurate to place the blame squarely on renewables.
Increased renewable energy generation may have contributed to decisions for some power plants to close. But so would other factors – such the A$400 million safety upgrade required for the Hazelwood power plant to have stayed open.
As mentioned above, other factors such as gas prices and competition issues have also contributed to increases in wholesale electricity prices. And as shown below, these are not confined to South Australia.
In this sense, Marshall was not correct to say that price increases are “all because this [Labor] government decided we had to go headlong into intermittent renewable energy without the baseload to support that transition”.
Indeed, a large proportion of the existing renewable investment in South Australia has been financed as a result of the federal Renewable Energy Target, introduced by the Howard government, rather than state policy. – Dylan McConnell
Blind review
I broadly agree with the verdict.
The price question is not contentious. South Australia has the highest retail electricity prices in Australia – but not in the world.
An argument could be made for South Australia being the least reliable system in the National Energy Market – if you look beyond the technical definition. A series of power losses and near misses in 2016-17 clearly raise questions for SA residents.
But, as the author rightly points out, the vast majority of these were caused by storms and other technical issues – not by renewables. – David Blowers
The Conversation is fact-checking the South Australian election. If you see a ‘fact’ you’d like checked, let us know by sending a note via email, Twitter or Facebook.
The Conversation FactCheck is accredited by the International Fact-Checking Network.
The Conversation’s FactCheck unit is the first fact-checking team in Australia and one of the first worldwide to be accredited by the International Fact-Checking Network, an alliance of fact-checkers hosted at the Poynter Institute in the US. Read more here.
Have you seen a “fact” worth checking? The Conversation’s FactCheck asks academic experts to test claims and see how true they are. We then ask a second academic to review an anonymous copy of the article. You can request a check at checkit@theconversation.edu.au. Please include the statement you would like us to check, the date it was made, and a link if possible.
Cicero, the Roman Stoic, once wrote to his friend Varro, pending a visit to his home: “If you have a garden in your library, we shall have all we want.” This same desire for good books and natural beauty is at the heart of Byung-Chul Han’s In Praise of the Earth, in which he reflects on gardening as a form of philosophical meditation.
Review: In Praise of the Earth: A Journey into the Garden – Byung-Chul Han (Polity)
Born in South Korea and based in Germany, Han has risen to prominence as a philosopher in the last ten years with a series of short, readable but penetrating works critiquing the values that govern contemporary capitalist society.
Han considers contemporary concerns like burnout, the loss of attention and information overload, drawing on thinkers such as Hegel, Marx and Nietzsche to diagnose the effects of digital capitalism.
As well as these canonical European thinkers, he considers the ideas of Eastern philosophers and poets like Lao Tzu and Bashō. Indeed he has written books on Zen Buddhism and the Chinese idea of shanzhai or “decreation”, which disrupts the usual hierarchy between real and fake.
Han is a rare thinker who can make complex ideas engaging without losing any of their intellectual acuity. He writes slim volumes, easily carried in a coat pocket, which brim with explosive diagnoses of contemporary ills while proposing new ways of living.
Byung-Chul Han pictured in 2015.Wikimedia Commons
In The Burnout Society, for instance, Han critiques the effects of what he calls “the achievement society”, in which efficiency and a relentless drive toward self-optimisation result in feelings of despair, loneliness and exhaustion. Against the tide of self-help manuals focusing on positivity and success, he suggests “rest and contemplation are acts of resistance against a world that demands constant productivity. In pausing we reclaim our humanity.”
In Praise of the Earth suggests the humble practice of gardening can offer one example of this kind of resistance. While he reflects on the deeper implications of gardening and thinking, Han’s book is also practical and personal. It is both a philosophical treatise on gardening and a diary of his experiences tending to his Bi-Won, Korean for “secret garden” in Berlin, over a period of three years.
Han describes gardening as a form of “silent meditation, a lingering in stillness”. Cultivating plants, he suggests, can transform our relationship to time. “Since I have begun working in my garden,” he writes, “I experience time differently. It passes much slower. It expands. The time until next spring feels like an eternity.”
This new sense of time is not only attuned to the changing seasons but to the growth of the plants and flowers he nurtures. “Every plant has its proper time,” he notes. “In the garden many such times overlap. The autumn crocus and the spring crocus have an altogether different sense of time.”
This awareness of overlapping time schemes prompts Han to reflect on what he describes as “the time of the other”, which invites an ethical response of care and concern. This time of the other is not related to acquisition or domination but instead thrives through a mutual act of cultivation.
For Han the time of the garden is fundamentally different to the time of digital capitalism, which is characterised by speed, distraction, and exploitation. “Digitalisation intensifies the noise of communication”.
In contrast, “the garden is an ecstatic place for lingering.”
The language of flowers
As a gardener, Han is entranced by the names of plants. Many of the book’s short chapters bear the names of those he is growing: Willow Catkins, White Forsythia, Anemones … These names prompt reflection: “Since I have taken up gardening, I try to remember as many flower names as possible.”
Reflecting on these names, Han begins to develop new ideas. He notes that astilbes are called Prachtspiere in German, which translates as “splendid splinters”. Spier means “small, tender tip”. He notes, “Without my garden, I would never have come across the word […] Such words widen my world.”
Astilbes, or splendid splinters.K8/unsplash, CC BY
His world also widens as his attention moves from language to nature more broadly and he starts to see plant life all around him in Berlin.
Before gardening, he writes, “I was in some way indifferent not only toward willow catkins but towards all plants. Today I see my former indifference as an embarrassing blindness.” Gardening opens our eyes to the movement of leaves and opens our ears to the buzzing of insects.
This reflection is complemented by Isabella Gresser’s botanical drawings interspersed throughout the book. The delicate, white line drawings on black paper are accompanied by the botanical names of the flowers in question, allowing the reader to linger.
Song of praise
The movement from the particular to the universal is one of the book’s great strengths. The practical problem of keeping a camellia alive on a snowy night prompts a reflection on care, while waiting for a Japanese allspice to bloom sparks a contemplation on the nature of hope. “Hoping is the temporal mode of the gardener,” Han writes.
Polity
By attending to the most minute bud of a flower Han believes we can begin to develop a “planetary consciousness”. This consciousness is accompanied by “a deep reverence for the Earth.”
This reverence is in turn complemented by one of the oldest philosophical sensations – that of wonder – which Plato described as the feeling that gives birth to philosophy.
In this spirit, Han writes,
We should learn again to wonder at the earth […] In the garden I experience that the earth is magical, enigmatic, and mysterious. As soon as you treat her as a resource to be exploited you have already destroyed her.
Han’s book is part of a long tradition of philosophical reflections on the art of gardening.
The followers of the ancient Greek philosopher Epicurus formed a community called “The Garden” where they practised philosophy among trees and flowers. Chinese literati found solace in ornamental gardens designed to reflect Taoist principles such as the unity of opposites.
It is also part of a recent wave of works in which contemporary thinkers reflect on the philosophical significance of gardens. Italian thinker Giorgio Agamben’s The Kingdom and the Garden (2019), for instance, illuminates the relationship between theological reflections on the biblical Garden of Eden and political theories of liberation.
In Praise of the Earth is a philosophical song, which finds in the most delicate blossom a resounding call for care. “Flowering is rapture,” Han writes and reading this book too, is a rapturous experience.
Virus. The word evokes images of illness and fears of outbreaks. Yet, in the oceans, not all viruses are bad news.
Some play a helpful, even critical, role in sustaining marine life.
In a new study, we and an international team of scientists examined the behavior of marine viruses in a large band of oxygen-rich water just under the surface of the Atlantic Ocean. What we discovered there – and its role in the food web – shows marine viruses in a new light.
Studying something so tiny
Viruses are incredibly small, typically no more than tens of nanometers in diameter, nearly a hundred times smaller than a bacterium and more than a thousand times smaller than the width of a strand of hair.
In fact, viruses are so small that they cannot be seen using conventional microscopes.
An electron microscope view shows examples of Prochlorococcus myoviruses. Images A and D show different viruses with their tails. In B and C, the tail is contracted. The black scale bar indicates a length of 100 nanometers.MB Sullivan, et al., 2005, PLOS One, CC BY
Decades ago, scientists thought that marine viruses were neither abundant nor ecologically relevant, despite the clear relevance of viruses to humans, plants and animals.
Then, advances in the use of transmission electron microscopes in the late 1980s changed everything. Scientists were able to examine sea water at a very high magnification and saw tiny, circular objects containing DNA. These were viruses, and there were tens of millions of them per milliliter of water – tens of thousands of times greater than had been estimated in the past.
A theory for how viruses feed the marine world
Most marine viruses infect the cells of microorganisms – the bacteria and algae that serve as the base of the ocean food web and are responsible for about half the oxygen generated on the planet.
By the late 1990s, scientists realized that virus activity was likely shaping how carbon and nutrients cycled through ocean systems. We hypothesized, in what’s known as the viral shunt model, that the marine viruses break open the cells of microorganisms and release their carbon and nutrients into the water.
This process could increase the amount of nutrients reaching marine phytoplankton. Phytoplankton provide food for krill and fish, which in turn feed larger marine life across the oceans. That would mean viruses are essential to a food web that drives a vast global fisheries and aquaculture industry producing nearly 200 million metric tons of seafood.
The team took samples from a meters-thick band of oxygen that spreads for hundreds of miles across the subtropical Atlantic Ocean. In this region, part of the Sargasso Sea, single-celled cyanobacteria known as Prochlorococcus dominate marine photosynthesis with nearly 50,000 to upwards of 100,000 cells in every milliliter of seawater. These Prochlorococcus can be infected by viruses.
[embedded content]
What are Prochlorococcus? Science Magazine.
By sequencing community RNA – molecules that carry genetic instructions within cells – our team was able to look at what nearly all viruses and their hosts were trying to do at once.
The viruses were attacking cells and spilling organic matter, which bacteria were taking up and using to fuel new growth. The bacteria respired away the carbon and released nitrogen as ammonium. And this nitrogen appears to have been stimulating photosynthesis and the growth of more Prochlorococcus cells, resulting in greater production that generated the ribbon of oxygen.
The viral infection was having an ecosystem-scale impact.
Scientists aboard a National Science Foundation research expedition in the open Atlantic in 2019 prepare equipment to collect water samples at different depths to analyze the activity of marine viruses.SW Wilhelm
Understanding the microscopic world matters
Viruses can cause acute, chronic and catastrophic effects on human and animal health. But this new research, made possible by an open-ocean expedition supported by the National Science Foundation, adds to a growing range of studies that demonstrate that viruses are central players in how ecosystems function, including by playing a role in storing carbon in the deep oceans.
We are living on a changing planet. Monitoring and responding to changes in the environment require an understanding of the microbes and mechanisms that drive global processes.
This new study is a reminder of how important it is to explore the microscopic world further – including the life of viruses that shape the fate of microbes and how the Earth system works.
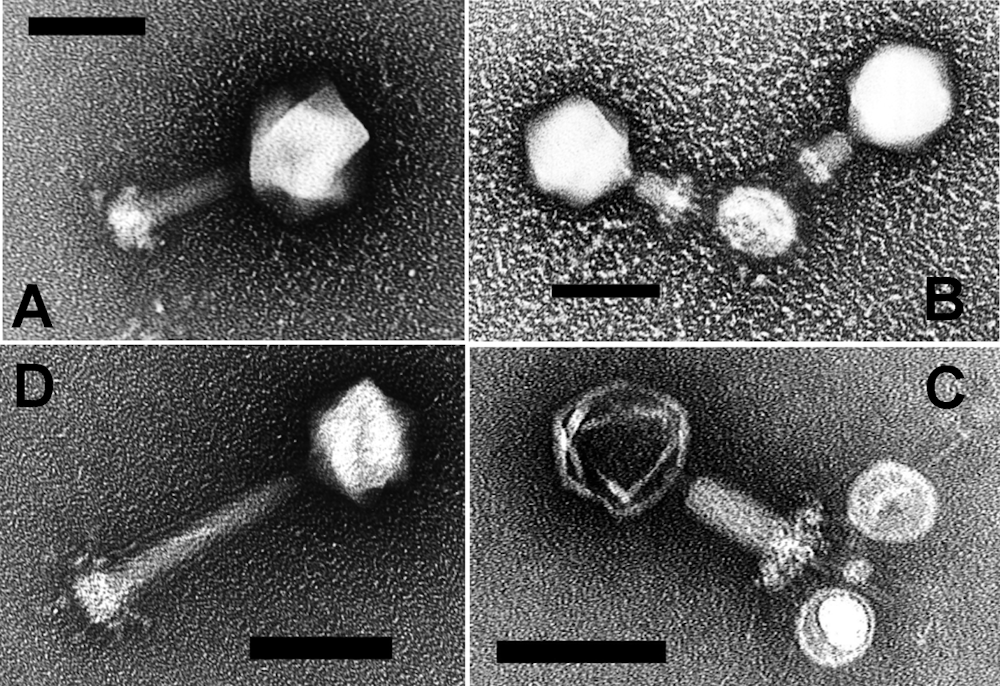